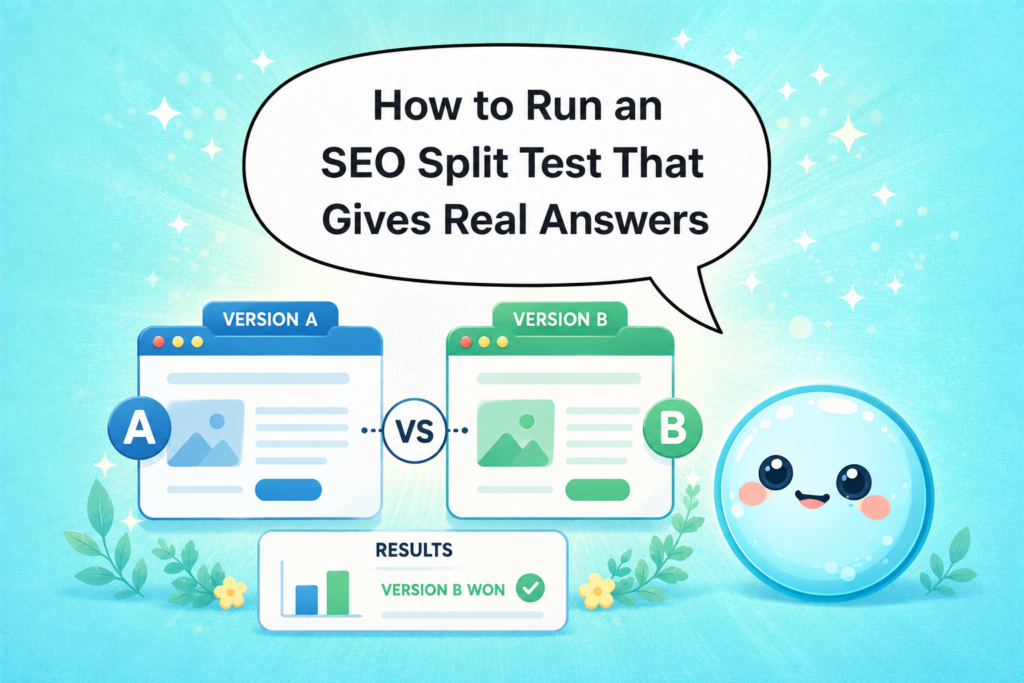

I check my clients’ Google Search Console data every single week, and I’ll be honest with you — the metric that confuses people the most isn’t impressions, it isn’t clicks, and it isn’t even click-through rate. It’s average position. I’ve had clients celebrate a drop from 8.2 to 6.1, and I’ve had others panic when their average position “got worse” from 12 to 15 — even though their traffic actually went up. If any of that sounds familiar, this guide is exactly what you need.
Understanding what is average position in Google Search Console is foundational to making smarter SEO decisions. In this post, I’m going to walk you through exactly how it works, why it can mislead you, and how to turn it into actionable ranking intelligence.
What Is Average Position in Google Search Console?
Average position in Google Search Console (GSC) is a GSC performance metric that tells you the mean ranking position of your website’s URLs across all the search queries they appeared for in a given date range. In simpler terms: when someone searches on Google and your page shows up, Google records which position it appeared in. Average position is the average of all those recorded positions.
According to Google’s official Search Console Help documentation, position is defined as the highest position your site appeared in the search results for a given query. If your site appears at positions 2, 4, and 6 for the same query in one search results page, Google counts it as position 2 — the highest (lowest-numbered) result.
Average position in Google Search Console is the mean of your site’s highest-ranking URL positions across all queries, date ranges, and filter conditions selected — it is not a direct measure of traffic potential or overall SEO health in isolation.
This is one of the most important things I want you to remember: average position is a blended number. It combines rankings from your highest-performing pages and your weakest pages into a single figure. That blended nature is both its strength and its biggest source of confusion.
How Google Calculates Average Position (And Why It’s Trickier Than It Sounds)
The Averaging Formula Explained Simply
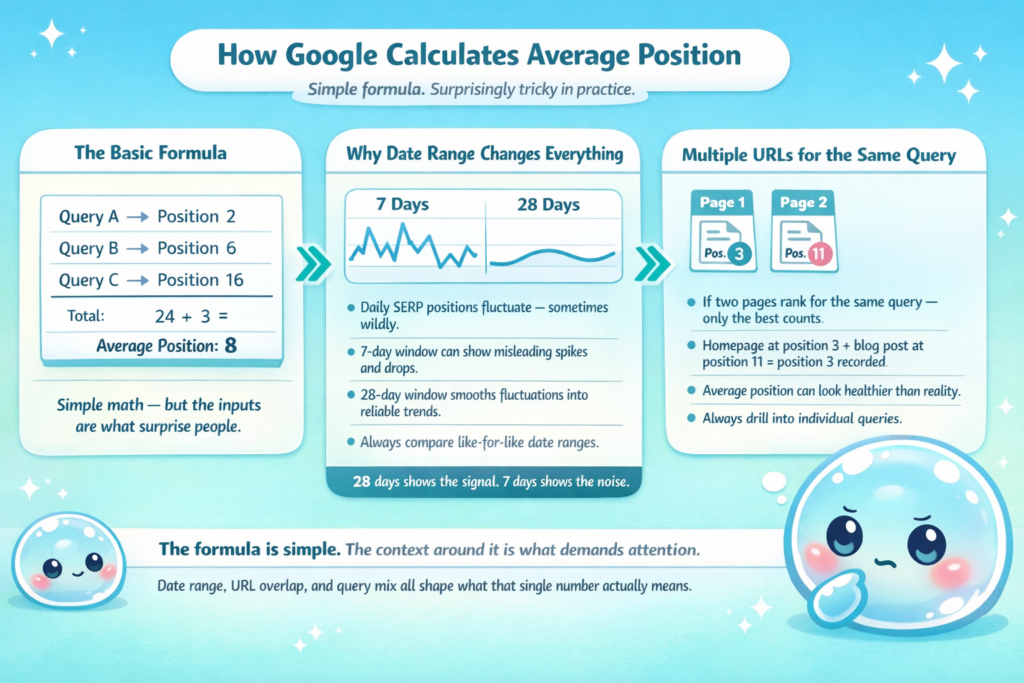
Let’s say your website ranks for 3 queries today. Query A puts you at position 2. Query B puts you at position 6. Query C puts you at position 16. Google adds those up (2 + 6 + 16 = 24) and divides by 3. Your average position is 8. Simple enough — but this is where things get interesting in GSC reporting.
The date range you select changes everything. I often run a 28-day comparison window for clients rather than a 7-day window, because daily fluctuations in SERP position tracking can be noisy. A 28-day view smooths out those fluctuations and gives you a more reliable signal about whether rankings are genuinely moving.
What Happens When Multiple URLs Rank for the Same Query
This is a subtlety that even experienced SEOs miss. If two of your pages show up for the same query — say, your homepage at position 3 and a blog post at position 11 — Google only counts position 3 in the average position calculation. It takes your best-performing URL for each query and uses that number.
This matters for ranking data interpretation because it means your average position might look healthier than it really is if you have many URLs that rank but most of them are ranking poorly. I always tell clients: don’t just look at the top-line average position. Drill into individual queries and individual pages.
Why Average Position Can Be Misleading — And How to Read It Correctly
The “More Pages” Paradox
Here’s a scenario I’ve lived with dozens of clients. A site publishes 20 new blog posts in a quarter. Their average position “gets worse,” jumping from 14 to 22. The client panics. But when I dig into the search console data, the original pages are holding their rankings perfectly — it’s the 20 new posts that are beginning to get indexed and ranking at positions 35–60 for new queries. Those lower positions are pulling the average up (which means worse, since lower numbers are better in rankings).
This is what I call the “more pages paradox.” Your content production is working, but the metric makes it look like you’re falling. The fix? Segment your GSC reports by page group or by date of first indexed to isolate new content from established content.
Branded vs. Non-Branded Queries
Another distortion I see constantly in search position average data: branded queries. Your brand name almost certainly ranks at position 1 or 2. If you’re a small site with 50 queries total and 10 of them are branded, those position-1 rankings are artificially inflating (or rather, improving) your overall average position. This makes your non-branded performance look better than it is.
I always filter out branded queries when reviewing average position for competitive analysis. In GSC, you can do this by adding a query filter and excluding your brand name. That gives you a cleaner view of how your content performs on purely informational and commercial keywords — which is where your real Search Engine Optimization (SEO) leverage is.
How to Use Average Position to Find Real Ranking Opportunities
The High-Impression, Low-Position Filter
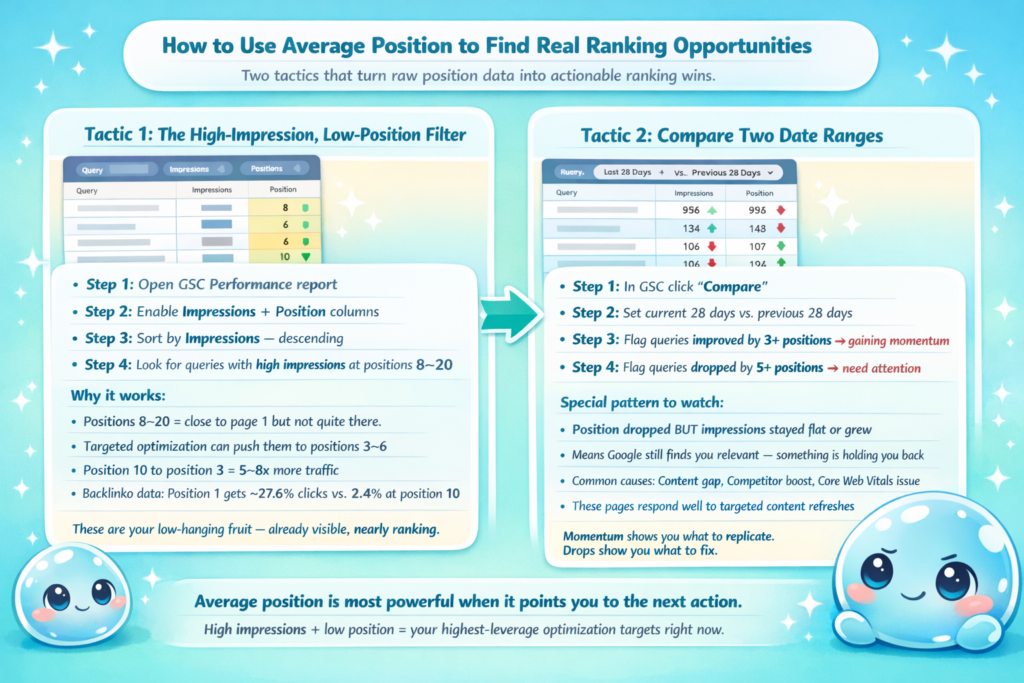
This is probably the single most valuable tactic I use when auditing a site’s GSC performance metrics. Inside Google Search Console, go to the Performance report, turn on both Impressions and Position columns, then sort by Impressions descending. Look for queries where you’re getting thousands of impressions but ranking at positions 8–20. Those are your “low-hanging fruit.”
Pages ranking between positions 8 and 15 are close to page 1 but not quite there. With targeted optimization — improving on-page relevance, building a few quality backlinks, improving page experience — these pages can jump to positions 3–6 and deliver significantly more clicks. Research from Backlinko shows the #1 result in Google captures approximately 27.6% of all clicks, compared to roughly 2.4% for results at position 10. Moving from position 10 to position 3 can multiply your traffic from that keyword by 5–8x.
Comparing Position Trends Over Time
One of my favorite uses of SERP position tracking is comparing two date ranges. In GSC, click “Compare” and set your current 28 days against the previous 28 days. Any query where your position has improved by more than 3 spots is a page that’s gaining momentum — worth identifying what’s working so you can replicate it. Any query where position has dropped by 5 or more spots is a page that needs a technical audit or content refresh.
I specifically look for queries where position dropped but impressions stayed flat or grew. That pattern usually means Google is still considering you relevant for the topic, but something — a content quality issue, a competing page that got stronger, or a Core Web Vitals problem — is holding you back from regaining your old spot.
Average Position vs. Other GSC Performance Metrics: What to Track Together
Average position alone tells you very little. The real insight comes when you correlate it with other search performance indicators. Here’s how I frame it for clients:
| Metric Combination | What It Tells You | Action to Take |
|---|---|---|
| High impressions + low position (15–30) + low CTR | You’re appearing but not ranking well enough to get clicks | Prioritize on-page optimization and link building for this query |
| High impressions + good position (1–5) + low CTR | You rank well but your title/meta isn’t compelling enough | Rewrite your title tag and meta description to improve CTR |
| Low impressions + good position (1–5) | You rank well for a low-volume keyword | Consider whether to pursue higher-volume related terms |
| Position improving + clicks declining | Rankings improving but SERP features (like featured snippets) are stealing clicks | Optimize for the featured snippet format |
According to Google’s Search Analytics documentation, clicks, impressions, CTR, and position are the four core dimensions in the Performance report — and they are designed to be analyzed together, not in isolation. I use this framework in every weekly search performance review I run for clients at sneo.ai.
When average position improves but click-through rate declines simultaneously, the most common culprit is a SERP feature — such as a featured snippet, People Also Ask box, or local pack — absorbing the clicks that would otherwise go to the top organic result.
How I Use sneo.ai to Decode Average Position Data for Clients
I built sneo.ai because I got tired of watching clients stare at GSC dashboards, completely overwhelmed, not knowing what question to ask next. sneo.ai is an AI-powered SEO assistant connected directly to your Google Search Console — and one of the things it does best is make sense of average position data without requiring you to become a data analyst.
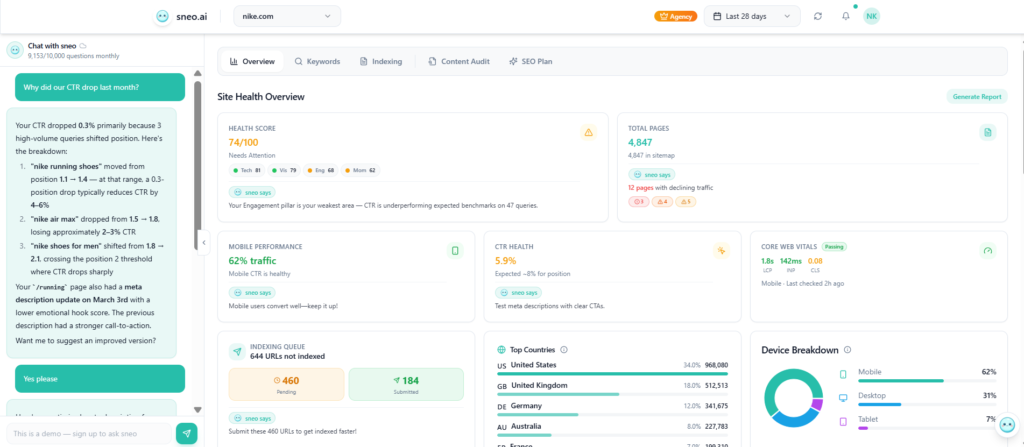
Just last month, I had a client ask me: “Rahul, my average position went from 18 to 26 in the last 30 days — what’s happening?” Instead of spending an hour digging manually, I pulled up sneo.ai, asked it to analyze her GSC data by page, and within seconds it identified that 3 specific blog posts had dropped significantly, all on topics related to a niche Google algorithm update that rolled out in February 2025. It flagged those pages, showed me the exact queries where they lost ground, and suggested content updates based on what the top-ranking competitors were covering.
That’s the kind of ranking data interpretation that used to take me 2–3 hours of manual work. With sneo.ai, it’s a conversation. You ask a question about your site, and I help you find the answer directly in your data.
Another scenario I see regularly: clients who understand what is average position in Google Search Console conceptually, but can’t act on it because they don’t know which pages to prioritize. sneo.ai solves this by automatically surfacing your highest-opportunity queries — the ones where small ranking improvements would generate the biggest traffic gains — based on your actual GSC data, not generic industry benchmarks.
If you haven’t connected sneo.ai to your Search Console yet, it takes about 2 minutes at sneo.ai. Your Google Search Console data, decoded — that’s the promise, and it’s one I’ve built the entire product around.
Frequently Asked Questions
1) What is a good average position in Google Search Console?
A good average position is generally between 1 and 10, meaning your pages appear on the first page of Google. Positions 1–3 typically drive the most clicks, with position 1 capturing roughly 27–39% of all clicks for a query. However, “good” depends on your niche, your competition, and your site’s age and authority. For a new site, moving from position 40 to position 20 is meaningful progress, even if it’s not yet on page 1.
2) Why does my average position go up (get worse) when I add more pages?
When you add new pages, they often rank for new queries at lower positions — typically 35–70. Because average position is a mean across all queries, these new lower-ranking queries pull your overall average upward (worse), even if your existing pages held their rankings perfectly. This is the “more pages paradox” I described above. Segment your data by page date range to see the true picture.
3) How is average position calculated in Google Search Console?
Google calculates average position by taking the mean of your highest-ranking URL’s position for each query, across all queries in the selected date range and filter set. If your page appears at position 3 for one query and position 9 for another, your average position is 6. If two of your pages appear for the same query, only the higher-ranked (lower-numbered) position is used in the calculation.
4) Does average position affect click-through rate?
Yes, significantly. Research from Backlinko shows that the #1 result in Google gets roughly 27.6% of all clicks, while position 10 gets around 2.4%. Improving your average position — even by 1–2 spots for high-impression queries — can lead to meaningful traffic gains. That’s why I always analyze average position alongside CTR when reviewing GSC reports for clients.
5) How often does Google Search Console update average position data?
Google Search Console typically updates performance data, including average position, with a delay of 2–3 days. You should not make rapid decisions based on single-day fluctuations; instead, analyze trends over 28-day or 90-day windows for more reliable insights. According to Google’s own documentation on data freshness, some data may take up to a week to appear fully in the Performance report.
Understanding Average Position Is Just the Beginning
I’ve spent years helping website owners make sense of their SEO performance, and understanding what is average position in Google Search Console is one of the most important foundational skills you can develop. It’s not a vanity metric — when read correctly and in context with impressions, CTR, and trend data, it’s one of the clearest signals you have about where your content stands in the competitive SERP landscape.
But here’s the truth: the data only has value if you act on it. You don’t need to become a data scientist or spend hours in spreadsheets. Start by connecting your Google Search Console to sneo.ai and asking me one question about your site. Whether it’s “which pages have the biggest ranking opportunity right now?” or “why did my average position drop last month?” — I’ll help you find the answer, directly in your data, without the guesswork.
Your rankings are telling a story. Let’s read it together.